


pandas를 이용한 데이터 분석이나 ML/DL 알고리즘 적용 시에 사전 단계로 EDA를 실시할 때 획기적인 패키지가 존재한다. 처음 pandas를 이용해 데이터프레임을 요리조리 뜯어 볼 때에는 상관관계며, 데이터 타입이며, 기술 통계량이며 하나씩 코드를 입력해서 공부하는 과정을 거쳤다. 하지만, 실제 업무나 kaggle, dacon 대회에 참여할 때에 EDA를 간략하고 빠르게 수행하기 위해서 pandas profiling 패키지를 사용하는 것이 효율적이다.
profiling 패키지는 판다스 데이터프레임 타입의 자료의 프로필 리포트를 작성해주는 패키지이다. describe() 의 기술통계량을 넘어서 상관관계 부터 최빈값, 결측값, 히스토그램 까지 한번에 HTML로 작성해서 보여준다.

- Type inference: detect the types of columns in a dataframe.
- Essentials: type, unique values, missing values
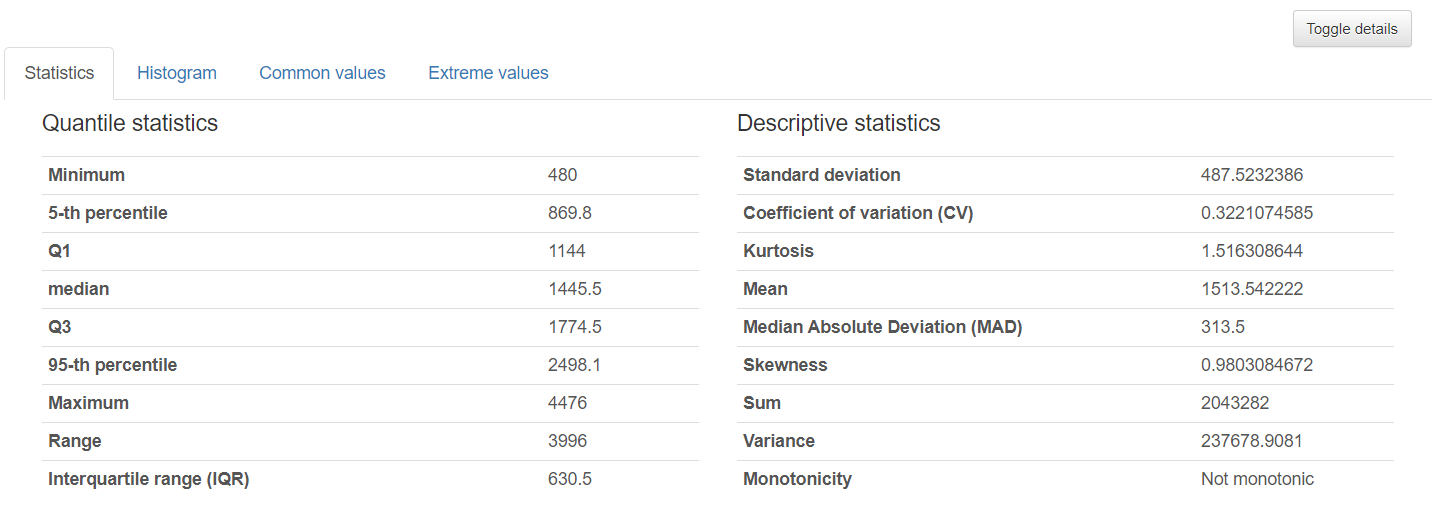
- Quantile statistics like minimum value, Q1, median, Q3, maximum, range, interquartile range
- Descriptive statistics like mean, mode, standard deviation, sum, median absolute deviation, coefficient of variation, kurtosis, skewness
- Most frequent values
- Histograms
- Correlations highlighting of highly correlated variables, Spearman, Pearson and Kendall matrices
- Missing values matrix, count, heatmap and dendrogram of missing values
- Duplicate rows Lists the most occurring duplicate rows
- Text analysis learn about categories (Uppercase, Space), scripts (Latin, Cyrillic) and blocks (ASCII) of text data
설치
프롬프트 창에서 실행하며 반드시 관리자 권한으로 실행하는 것을 잊지 말자! (권한 에러 발생)
pip install pandas-profiling프롬프트 창 설치 OS ERROR 발생시 (권한 에러)
pip install --user pandas-profiling적용
dacon 집값 예측 데이터를 사용하여 profiling을 실습해보자
import pandas as pd
import pandas_profiling

df = pd.read_csv('train.csv', encoding='utf-8')
df = df.drop('id',axis=1)
profile = df.profile_report()
Overview

데이터 프레임의 리포트를 간략하게 제공한다. 변수(컬럼) 갯수, 관측치 갯수, 결측값, 같은 값인 행의 갯수, 메모리 등의 데이터셋의 통계량과 변수(컬럼)들의 자료형을 알려준다. Alerts의 경우 주로 피쳐 간의 높은 상관관계를 알려주는 경고문이다.
Variable - Numeric (수치형 피처)
- Distinct : 고윳값의 갯수와 비율
- Missing : 결측값의 갯수와 비율

- toggle details : 통계량, 히스토그램, 최빈값 분석, 이상값 분석 등을 제공한다.


Variable - Categorical (범주형 피처)

- toggle details


Interactions
- 독립변수와 반응변수를 피처별로 선택하여 두 변수의 관계를 시각화하여 보여줌
- 주로 타겟과의 관계를 피처별로 살펴보는 EDA 과정에서 유용하게 사용됨

Correlations
- 피쳐간의 상관관계의 시각화
- correlation 값 또한 다양한 방식으로 도출 간으 (default : Spearmans's rho)

Missing Valuse
- 컬럼 별로 결측값 여부에 대한 시각화 제공 (count bar plot, matrix)

Sample
- dataframe.head(10), dataframe.tail(10) 상위, 하위 10개 값 보여줌
Duplicate rows
- 완전히 같은 값을 가진 row가 있을 경우 알려줌 → 전처리 시에 눈여겨 봐야할 부분

Html 형식으로 별도로 저장하기
profile.to_file('./profile_report.html')
Dacon competition에 참여하던 중 profiling 패키지를 발견하여 정리해 보았다. ML 알고리즘 적용전 EDA 단계에서 데이터셋이 너무 많은 경우 어떠한 부분에 집중하여 전처리 이슈를 결정할 것인지가 고민이 되었다. profiling 패키지를 이용하면 여러 EDA를 복합적으로 적용할 수 있으므로 해당 데이터 셋에서 ML 알고리즘을 적용할 때 어떤 문제가 발생할 수 있는지 감을 잡기 수월하였다. 앞으로 자주 사용하게 될 것 같다. 끝으로 Profiling profiling 공식 github 페이지와 포스팅에서 사용한 html 파일을 남긴다.
https://pandas-profiling.github.io/pandas-profiling/docs/master/rtd/index.html
Introduction — pandas-profiling 3.1.1 documentation
Descriptive statistics like mean, mode, standard deviation, sum, median absolute deviation, coefficient of variation, kurtosis, skewness
pandas-profiling.github.io
'Data Science > python' 카테고리의 다른 글
| [python] selenium element 클릭 (0) | 2022.03.14 |
|---|---|
| [pandas] dataframe 행 추가/제거 (0) | 2022.02.09 |
| sklearn.model_selection.GridSearchCV 정리 (0) | 2022.01.30 |
| sklearn.model_selection.cross_val_score 인자 정리 (0) | 2022.01.30 |
| [pandas] dataframe/series 형태 train_test_split() 적용 (0) | 2022.01.30 |